Body
Pressure and Temperature Plots for Large Rocker
Lessons Learned from the Following Three Plots:
- PV = nRT as T increases, P increases as governed by P1/P2 ≈ T1/T2.
- When programming the temperature range for the experiment run, temperature overshoot should be expected (usu. ~10 °C, although initially may be more). This was shown to be the case in all three experiments below.
- Better temperature control is obtained using the thermowell temperature control (regulates temperature from within), rather than thermowell jacket (regulates temperature from the outside jacket).
- PInitial ≈ PFinal, signifying minimal to no loss in pressure during experiment.
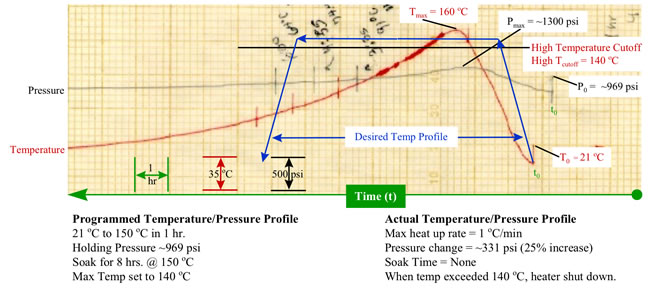
Plot 1

Lessons Gathered from Plot 1:
The maximum temperature cutoff works properly. Tsoak (programmed) was set to 150 °C, while the maximum. Temperature cutoff was only set to 140 °C. When the temperature exceeded 140 °C, the heater shut off and stayed off. Because of the residual heat in the heater and liner, the temperature continued to increase up to 160 °C before the cool down commenced.
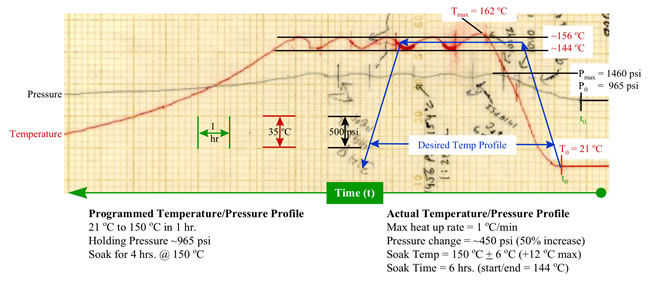
Plot 2

Lessons Gathered from Plot 2:
- Temperature oscillates based on the TSoak: the higher the TSoak, the higher the OscillationFrequency. (Compare 1st and 3rd plots.)
- TSoak (ave) = Tsoak (programmed) at higher temperatures.
- The soak time tends to overshoot by quite a bit and should be taken into consideration.
- The max. heat up rate is 1 °C/min, thus ramp time should be adjusted accordingly. If ramp time is not long enough, the soak will still not begin until the set temperature is reached.
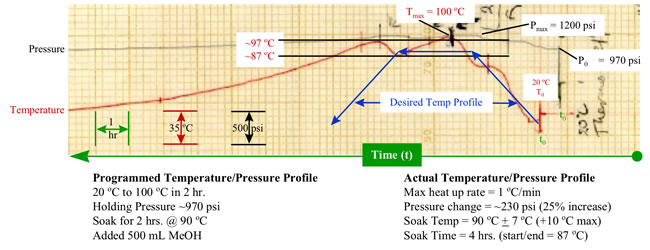
Plot 3

Lessons Gathered from Plot 3:
- Temperature oscillates based on the TSoak: the higher the TSoak, the higher the OscillationFrequency. (Compare 1st and 3rd plots.)
- TSoak (ave) > Tsoak (programmed) at lower temperatures.
- The soak time tends to overshoot by quite a bit and should be taken into consideration.
- When the ramp time is set for too long, the temperature will oscillate during the set ramp time.
Lessons Learned From This Data
- PV = nRT; as T increases, P increases as governed by P1/P2 ≈ T1/T2.
- PInitial ≈ PFinal, signifying minimal to no loss in pressure during experiment.
- Temperature oscillates based on the TSoak: the higher the TSoak, the higher the OscillationFrequency. (Compare 1st and 3rd plots.)
- TSoak (ave) = Tsoak (programmed) at higher temperatures. (Refer to 1st plot.) TSoak (ave) > Tsoak (programmed) at lower temperatures. (Refer to 3rd plot.)
- When programming the temperature range for the experiment run, temperature overshoot should be expected (usu. ~10 °C, although initially may be more). This was shown to be the case in all three experiments.
- The soak time tends to overshoot by quite a bit and should be taken into consideration. (Refer to 1st & 3rd plot.)
- The max. heat up rate is 1 °C/min, thus ramp time should be adjusted accordingly. If ramp time is not long enough, the soak will still not begin until the set temperature is reached. (Refer to 1st plot) When the ramp time is set for too long, the temperature will oscillate during the set ramp time. (Refer to 3rd plot.)
- The max. temp cutoff works properly. (Refer to 2nd plot.) Tsoak (programmed) was set to 150 °C, while the max. temp was only set to 140 °C. When the temperature exceeded 140 °C, the heater shut off and stayed off. Because of the residual heat in the heater and liner, the temperature continued to increase up to 160 °C before the cool down commenced.
NOTE:
Better temperature control is obtained using the thermowell temperature control (regulates temperature from within), rather than thermowell jacket (regulates temperature from the outside jacket).